Go언어 golang
고랭 엑셀 - golang excel #3 차트 삽입
미래의 고
2023. 3. 8. 21:39
excelize의 차트를 사용해 보겠습니다.
에 접속해보면 다양한 차트 타입을 확인해 볼 수 있습니다.
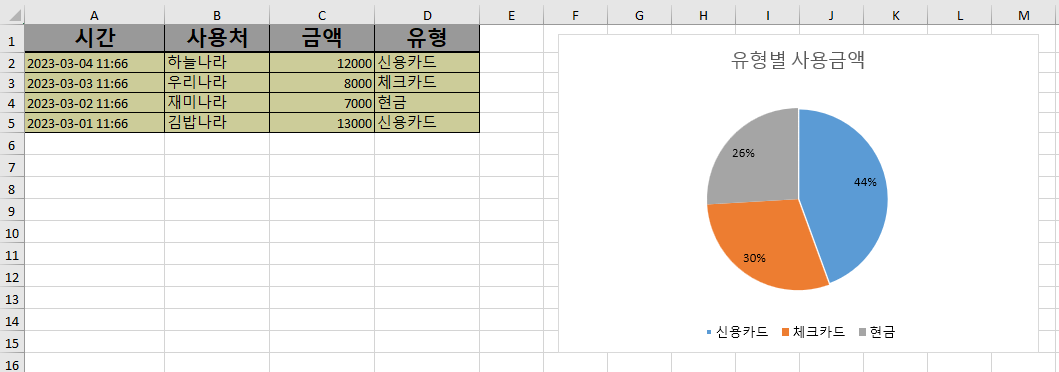
일하다 보면 제일 이해하기 쉬운(많이 쓰이는) Pie 차트를 가지고 샘플을 하나 만들어 보았습니다.
다음과 같은 결과를 기대할 수 있습니다.
package main

import (
   "fmt"
   "github.com/xuri/excelize/v2"
   "strconv"
   "time"
)

func genMockData() [][]string {
   //시간, 사용처, 금액, 비고
   return [][]string{
      {"2023-03-04 11:66", "하늘나라", "12000", "신용카드"},
      {"2023-03-03 11:66", "우리나라", "8000", "체크카드"},
      {"2023-03-02 11:66", "재미나라", "7000", "현금"},
      {"2023-03-01 11:66", "김밥나라", "13000", "신용카드"},
   }

}

func getCellStyle(f *excelize.File, style string) int {
   switch style {
   case "header":
      style, err := f.NewStyle(&excelize.Style{
         Font:      &excelize.Font{Bold: true, Size: 16},
         Alignment: &excelize.Alignment{Horizontal: "center"},
         Border: []excelize.Border{
            {Type: "left", Color: "000000", Style: 1},
            {Type: "top", Color: "000001", Style: 1},
            {Type: "bottom", Color: "000000", Style: 2}, // 2 굵은 선
            {Type: "right", Color: "000000", Style: 1},
         },
         Fill: excelize.Fill{Type: "pattern", Color: []string{"999999"}, Pattern: 1},
      })
      if err != nil {
         panic(err)
      }
      return style
   default:
      style, err := f.NewStyle(&excelize.Style{
         Border: []excelize.Border{
            {Type: "left", Color: "000000", Style: 1},
            {Type: "top", Color: "000000", Style: 1},
            {Type: "bottom", Color: "000000", Style: 1},
            {Type: "right", Color: "000000", Style: 1},
         },
         Fill: excelize.Fill{Type: "pattern", Color: []string{"CCCC99"}, Pattern: 1},
      })
      if err != nil {
         panic(err)
      }
      return style
   }

}

func main() {
   f := excelize.NewFile()

   sheetName := "ex1"
   sheet, err := f.NewSheet(sheetName)
   if err != nil {
      fmt.Println(err)
      return
   }

   f.SetColWidth(sheetName, "A", "A", 20) // 시간 컬럼 넓이
   f.SetColWidth(sheetName, "B", "D", 15) // 사용처, 금액, 비고 컬럼 넓이

   styleDefault := getCellStyle(f, "")
   styleHeader := getCellStyle(f, "header")

   rs := genMockData()

   // print header
   f.SetCellValue(sheetName, "A1", "시간")
   f.SetCellValue(sheetName, "B1", "사용처")
   f.SetCellValue(sheetName, "C1", "금액")
   f.SetCellValue(sheetName, "D1", "유형")
   f.SetCellStyle(sheetName, "A1", "D1", styleHeader)

   // print data
   startRow := 2
   countRow := 0
   for i, row := range rs {
      intRow2, err := strconv.Atoi(row[2])
      if err != nil {
         continue
      }
      f.SetCellValue(sheetName, fmt.Sprintf("A%d", i+startRow), row[0])
      f.SetCellValue(sheetName, fmt.Sprintf("B%d", i+startRow), row[1])
      f.SetCellValue(sheetName, fmt.Sprintf("C%d", i+startRow), intRow2)
      f.SetCellValue(sheetName, fmt.Sprintf("D%d", i+startRow), row[3])
      f.SetCellStyle(sheetName, fmt.Sprintf("A%d", i+startRow), fmt.Sprintf("D%d", i+startRow), styleDefault)
      countRow++
   }

   if err := f.AddChart(sheetName, "F1", &excelize.Chart{
      Type: "pie",
      Series: []excelize.ChartSeries{
         {
            Name:       "name",
            Categories: fmt.Sprintf("%s!$D$%d:$D$%d", sheetName, startRow, countRow),
            Values:     fmt.Sprintf("%s!$C$%d:$C$%d", sheetName, startRow, countRow),
         },
      },
      Format: excelize.GraphicOptions{
         OffsetX: 15,
         OffsetY: 10,
      },
      Title: excelize.ChartTitle{
         Name: "유형별 사용금액",
      },
      PlotArea: excelize.ChartPlotArea{
         ShowPercent: true,
      },
   }); err != nil {
      fmt.Println(err)
      panic(err)
   }

   filename := fmt.Sprintf("%s.xlsx", time.Now().Format("2006-01-02-1504"))

   f.SetActiveSheet(sheet)
   if err := f.SaveAs(filename); err != nil {
      fmt.Println(err)
   }
   fmt.Println("생성 완료")
}